The key is a well-designed omnichannel strategy. This involves fully linking various online and offline channels, e.g., online store, marketplace, app, and brick-and-mortar store. As a result, the customer can conveniently and seamlessly switch between channels during the information and purchasing process. How could such an omnichannel buying process look like?
For example, a potential customer can find out more about your product range on your website and then go directly to a nearby pop-up store to try out the product. With the help of a QR code, he/she can quickly and easily order the item to his/her home via mobile phone while still being in the store.
Another case: A customer notices a product on your poster and scans the printed QR code, which takes him/her to the product page. However, he/she would rather buy the product via your app, which can be accessed with a single click. There, he/she selects the click & collect option and picks up the latest acquisition in the store.
Are you planning to expand your omnichannel strategy for 2023? Then you may be asking yourself questions like:
- What is the online shopping affinity of my target group?
- Where is the ideal location for my pop-up store?
- Or, most importantly, in which regions and for which product categories is purchasing power likely to be highest – both online and offline? Am I exploiting my potential and investing in the right place?
A first step can be to visualize stores, customers, click & collect transactions and returns on a map to identify patterns. With the MBI Geocoder, you can assign addresses to a coordinate and visualize them on a map with the MBI Boundaries. You can then compare this now clearly presented data with market data to discover new opportunities and areas for action.
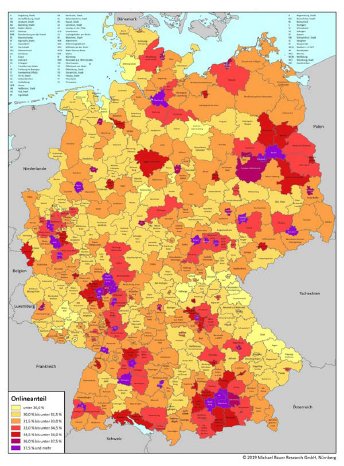
In the area of online retailing, MBI's data on Online Shopping Affinity can be used to determine where particularly large numbers of people who potentially like to shop online live worldwide. You can match this data with your customer data to find out if you already have many customers from areas with a high affinity for online shopping. Or would a targeted campaign for your online store be a good idea in these areas?
For many companies, there is an even more important question than the question of the number of customers: How high are the sales figures in the various areas and where is hidden potential for even higher sales? A good way to find out is to visualize this key figure as well and compare it with MBI's General Purchasing Power and Online Purchasing Power. MBI's Online Purchasing Power data is available at administrative, postcode and microgeographic level in Germany. The granular breakdown of Online Purchasing Power into 39 product groups (such as "furniture," "sportswear," and "small electrical appliances") enables precise analyses for your product range. In which regions do customers have a high Online Purchasing Power, but still generate little sales? This is where increased marketing could pay off for you.
You can also gain interesting insights by comparing several product ranges with each other or by comparing General Purchasing Power and Online Purchasing Power within the individual product ranges. MBI's globally consistent and comparable General Purchasing Power is also available including a categorization according to 20 product groups. For Germany, it further distinguishes 39 even more granular subdivided assortments. For example, it can be used to determine exactly how high the Purchasing Power is for shoes in stores in Munich. In addition to other MBI data, Purchasing Power is a good indicator for planning pop-up stores or Ghost Kitchens. For more information, please contact our sales team.


