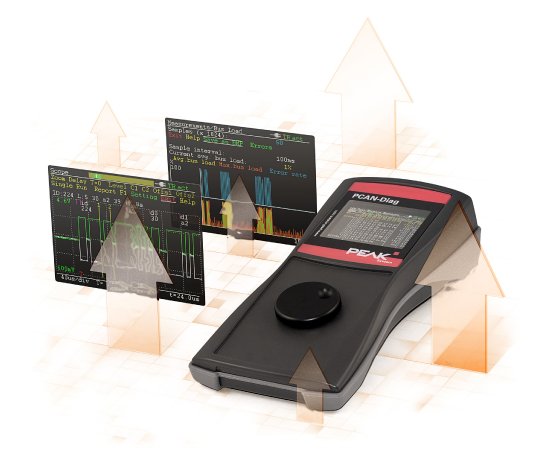
The busload diagram can display an additional graph for busload that is generated by error frames. This is done in a split view parallel to the busload by regular CAN frames.
If the oscilloscope function identifies the sampled signal course as a CAN frame, the new report function shows detailed characteristics of that frame. Thus, conclusions about the structure of the CAN network are possible.
Two different display modes are now available for multiplexer variables. Either all variables of a multiplexer are shown together or they are displayed separately for each multiplexer state.
A software package is available for download from PEAK-System's website. It contains the new firmware 1.7.0, device help, Windows tools for the PCAN-Diag, and documentation.
Additional information about the PCAN-Diag:
The PCAN-Diag can display the data traffic from a connected CAN bus in a basic manner in hexadecimal format as well as in symbolic form. The other way, CAN messages may be transmitted, e.g. for maintenance purposes. For later review of the data stream, there's a trace function for recording. At faulty communication, the diagnostics can be refined with busload measurements or, on hardware layer, with termination and voltage measurements. An accurate picture of the waveform on the CAN lines is obtained with the dual-channel oscilloscope function.
Find further information on the product web page:
http://www.peak-system.com/...


