The LPC4300 family brings together an ARM Cortex-M4 with a Cortex-M0 to an asymmetrical dual-core digital signal controller (DSC) architecture. Both processors each operate with their own clock supply and their own power management. However, the communication takes place via a shared memory.
The JTAG/SWD interface - by which debugging on both cores is possible - is also shared. This requires an intelligent management of the on-chip resources from the debugger. With the UDE 3.0.7, for example, code breakpoints and watchpoints can be set directly in the program window or watch window of the respective Cortex-M. Furthermore, CoreSight diagnostic technologies such as serial wire viewer (SWV), instrumentation trace macrocell (ITM), and data watchpoint and trace (DWT) are extensively supported by the UDE 3.0.7. This guarantees the user a wide range of capabilities. An observation of systems while the application is running is achieved entirely without, or only a very small, change of the timing behavior. The recorded data can be graphically displayed in single form or in linked expressions. A time base for the display can be provided from the target or also from the host PC.
In addition, depending on the type, the new LPC4300 family also provides developers with various peripherals such as USB, CAN, Ethernet, LCD controller, PWM and ADC. These on-chip peripheral modules can be visualized and configured in the debugger at symbolic level in text form. Furthermore, a full Eclipse integration with complete cross debugger functionality is included in the comprehensive test and debug tool UDE 3.0.7.
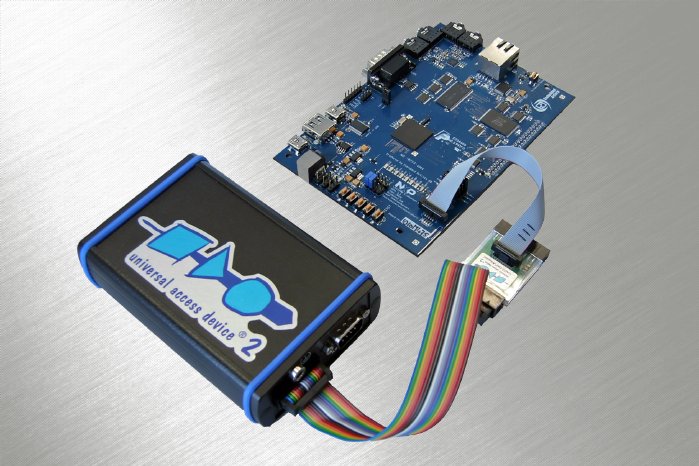
The JTAG/SWD debug interface of the LPC4300 device is supported by the special JTAG extender of the Universal Access Device family (UAD2+/UAD3+) from PLS and enables a distance of several meters between target and host PC with high immunity against interferences. For LPC4300 developers, this means that the same proven tool is always available for application development, field testing and then later also in customer service.

