The latest version of the Universal Debug Engine (UDE) 3.0 supports the extended debug and test capabilities of the Cortex-M4 cores, without any limitations of any kind. For example, new technologies such as Serial Wire Viewer (SWV), Instrumentation Trace Macrocell (ITM) and Data Watchpoint and Trace (DWT) allow an observation of systems while the application is running. This is achieved entirely without or only very little change of the timing behavior. The recorded data can be graphically displayed in single form or in linked expressions. A time base for the display can be provided from the host PC or also from the target.
Kinetis MCUs with integrated CoreSight Embedded Trace Macrocell (ETM) open up new additional functions for users such as profiling or code coverage. Furthermore, recordings of the program flow and the display as execution sequence diagram are possible.
The intuitive and individually configurable user interface of the UDE 3.0 offers Kinetis users in addition to unrestricted C/C++ support, a powerful symbol browser, individually configurable toolbars, extensive context related menus and HTML as description language for application-specific windows. At the same time, the use of standard script language ensures a high level of automation.
The new Kinetis MCUs feature high-performance and low-power consumption. Depending on the type, they also provide users with different analog, communication, timer and control peripheral units. These on-chip modules can be visualized and configured in the debugger at symbolic level in text form. Furthermore, a full Eclipse integration with complete cross debugger functionality is included in the comprehensive test and debug tool UDE 3.0 at no additional cost.
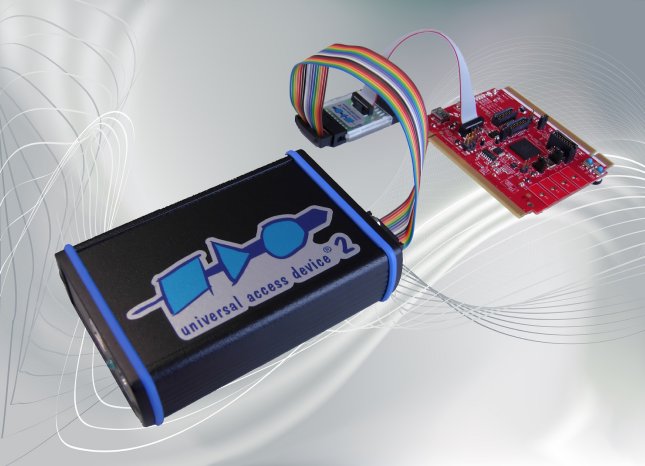
Access to the target takes place via the supplementary Universal Access Devices UAD2 and UAD3+ from PLS, whereby the UAD3+ enables the user multi-target support with debug clock rates of up to 100 MHz and up to 4 GByte trace memory (CoreSight ETM).

