The "Go" version of the new ProfiSignal 20 measurement technology software is used for fast visualisation, monitoring, analysis and archiving of measurement data. In addition to versatile, configurable and, when required, multi-axis y(t) diagrams, new cascade diagrams are now also available. These enable measurement data from multiple channels to be displayed synchronously for instant comparison. y(x) diagrams for analysing correlations between different measured variables are also available. ProfiSignal 20 uses hardware-related calculation routines to enable lightning-fast switching between live and historical measurement data as well as ultra smooth zoom functions. ProfiSignal 20 Go’s range of features are rounded off by powerful statistical functions for data analysis, a recorder function for carrying out series tests and measurement data export to various file formats.
The ProfiSignal 20 "Basic" version enables users to create individualised diagrams for visualisation and process control. A wide range of control and monitoring elements are therefore provided, which can be combined to create user-defined dashboards. An object designer greatly simplifies the creation of complex projects as well as multiple projects with similar visualisations. All functions in ProfiSignal 20 Go, with its range of diagram types and analysis and export functions, are also fully included in ProfiSignal 20 Basic.
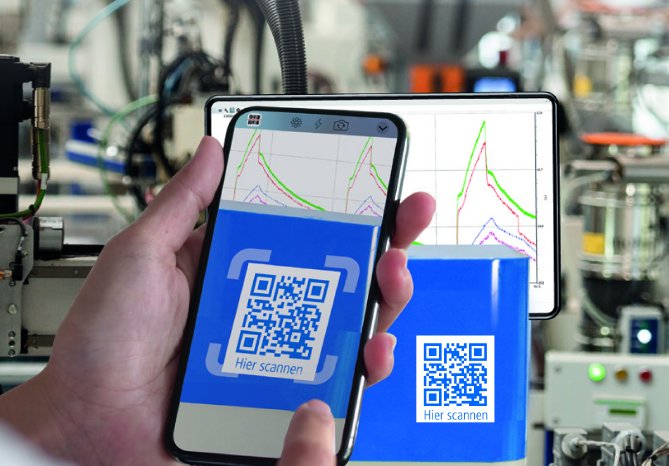
A further ProfiSignal 20 feature is its innovative SCACH function. Simply scanning QR codes via a smartphone or tablet gives access via the mobile device’s display to selected machine data as well as full system visualisations. Measurement data analysis and process control have never been easier.

