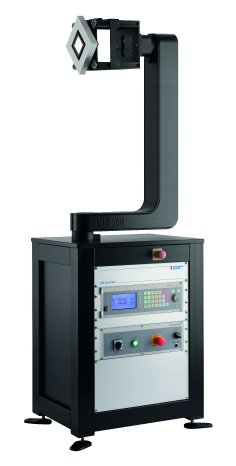
The LGS 650 goniophotometer was developed for the analysis of angle-dependent spatial radiation properties and offers a cost effective alternative to the LGS 1000. The test specimen is operated in a horizontal burning position and measurements can be taken at an angular range of ± 160 ° in the gamma axis. The angular resolution of 0.01 ° enables very fine measuring grids recorded with a high level of accuracy and reproducibility. The LGS 650 is compliant with all relevant specifications in conformity with CIE, DIN and IES standards. The probes may have a diameter up to max. 1300 mm and a maximum weight of 10 kg.
Combined with a spectroradiometer, e.g. CAS 140D, from Instrument Systems, all spectral quantities such as color coordinates, color temperature and even color rendering index can be determined as a function of angle. Spectroradiometers offer the distinct advantage that all radiometric, colorimetric or photometric characteristics can be determined with maximum precision. Instrument Systems also supplies very fast photometers, e.g. the newly developed DSP 200, for performing integral measurements. They are recommended for pure photometric measurements and for time critical test sequences. Combined with the LGS 650, the photometers allow ‘on-the-fly’ measurements, meaning the measuring system records the light distribution while the goniometer is moving.
The LGS 650 is operated via the goniometer module of the SpecWin Pro software. The software routinely performs measurement sequences to record the spatial radiation pattern of the test specimen. SpecWin Pro controls the power supply to the test specimen and records electrical data. Voltage, current, switch-on and burn-in procedure as well as the sequencing are storable presets and can be retrieved for repeat measurement functions. The graphics window is the central element of the user interface of SpecWin Pro. This window displays all measurements. Several different display options are available for the spatial radiation pattern: Radial display (luminous intensity distribution curve), semi-radial and cartesian view, and a two dimensional spherical display with Isocandela lines and a 3D view. The measured results can also be exported in IES and EULUMDAT format for use in simulation programs.
www.instrumentsystems.com


