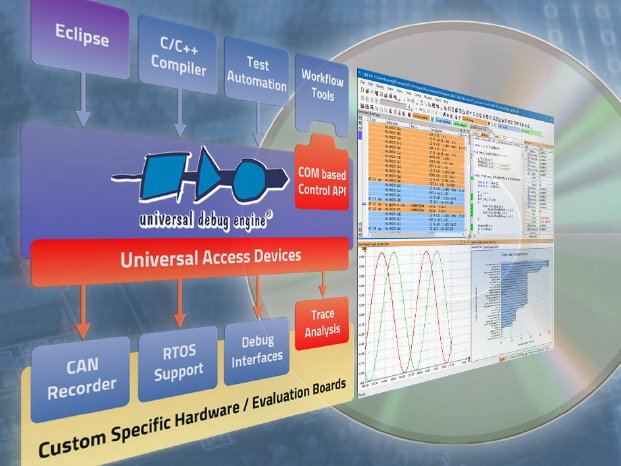
Nowadays, thanks to high performance, modern access hardware, such as PLS’ Universal Access Device 3+ (UAD3+) and particularly broadband trace interfaces like Aurora, for high-end SoCs up to 4 GB trace data can easily be recorded. The enhanced trace analysis of the UDE 4.8 now allows developers to search even faster through this very large amount of trace data. The ‘Find all’ function of UDE 4.8 searches not only for single events such as, for example, function entries or accesses to specific memory locations, but also for entire sequences of events in one single search run through the complete dataset. The search results are presented to the user by bookmarks which allow a very easy and comfortable navigation.
Furthermore, the UDE 4.8 has been expanded with a comprehensive call graph analysis for more efficient investigation of runtime behavior. Besides presentation of call hierarchy of functions it also provides developers with valuable profiling information for optimization tasks. Once obtained, the trace data are stored in a databank and can be loaded again from there at any time. Since the actual trace analysis can also be performed offline optionally, usual long occupancy times, for instance, of an expensive Hardware-in-the-loop (HIL) system, can be avoided.
Another new feature is the add-in for evaluating runtime behavior of real-time operating systems according to the OSEK (Open Systems and their Interfaces for the Electronics in Motor Vehicles) standard. Alone through the trace-based observation of operating system variables, defined for example by the OSEK Run Time Interface (ORTI), the UDE 4.8 can collect runtime information without instrumentation of the operating system, which would be necessary otherwise. An export function for the Best Trace Format (BTF) simplifies the subsequent evaluation and visualization of the analyzed data using popular task analysis tools.
For version 4.8 of the Universal Debug Engine (UDE) the documentation of the COM-based automation interface was completely revised. Among other things, additional samples take UDE’s support for various scripting languages into account. The COM interface allows not only controlling UDE completely by scripts and setting up automated test runs, it is also intended to enable a close tool coupling of third-party tools and thus as an efficient, robust and rapid access to the target.
Besides the UDE 4.8 user interface, which is specifically tailored for efficient and user-friendly multicore debugging, there is also an own perspective for the Eclipse development environment available, that provides the complete cross-debugger functionality as well.
The UDE 4.8 features full support of various up-to-date, high-end multicore microcontrollers including AURIX TC39 from Infineon, Renesas RH850 family or the latest devices of the STMicroelectronics SPC58NE product line.


