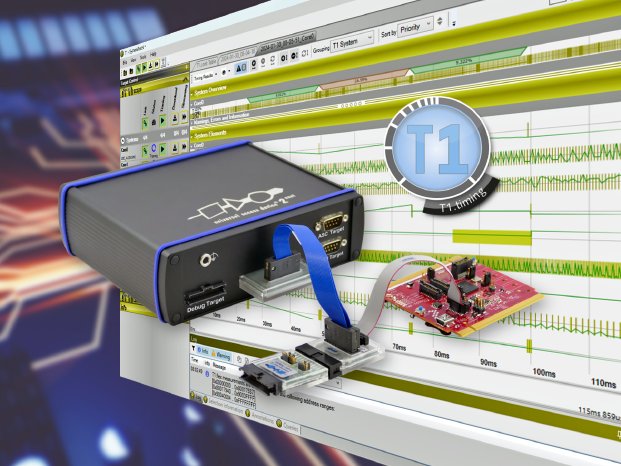
GLIWA T1.timing offers a wide range of tools for investigating and optimizing the timing behavior of embedded software. On the one hand, this includes the profiling of all relevant timing data like core execution time (CET) or response time (RT). The customer can define constraints (e.g., accepted worst case execution time (WCET)) which is supervised by T1.timing on the target and can be used for use case specific triggers. On the other hand, tracing is supported to get deep insights about the system behavior on operating system and functional level over time in GANTT diagram style visualization. All this can be automated by customer with help of an API (T1.api). T1.timing is based on software tracing and requires a communication channel to download the timing information from the target and to upload control information to the target. This communication channel is provided by PLS’ debug and trace tool UDE via the debug unit of the underlying controller.
The UDE is a complete and powerful development tool for debugging, tracing, and testing embedded software for microcontrollers and embedded processors. In combination with the debugger devices UAD2pro, UAD2next or UAD3+ from the Universal Access Device family, the UDE enables fast and reliable communication with the microcontrollers at the heart of each ECU via the specific debug interfaces. In addition to interactive debugging capabilities, UDE provides the UDE Object Model, an open and flexible software API for scripting and tool coupling.
With the GLIWA T1 V3.6.1 release, the PLS UDE is seamlessly integrated into the T1-HOST-SW and now appears in the list of available hardware interfaces. GLIWA T1 makes use of UDE Object Model which enables T1 to collect timing information directly from real ECU hardware.
The users of the T1.timing and PLS’ UDE will benefit from the integration by having a tool that is very easy and convenient to use. T1-HOST-SW will automatically detect the connected UDE in the host system and offer this as communication interface to the user. Then, T1.timing can use the PLS UDE to download the timing information from the target, and to write control data to the target. In a next step, the timing data can be analysed by the developer to reduce the CPU load or to optimize the scheduling for example.
It was already possible to use PLS debugger infrastructure for downloading trace data and import it to T1 in the past. But the procedure includes several manual steps and not all features of T1.timing were supported. Therefore, the new integration provides the following benefits to users of both tools:
- Efficiency increase: smooth & easy integration of the PLS UDE Universal Debug Engine as communication interface to T1.timing.
- Extended Usability: extended analysis and debugging capabilities by PLS’ UDE and T1.timing.
- Rapid Prototyping: no other additional hardware/software is required for the embedded software development.
The support of PLS UDE is included in T1 V.3.6.1 release which is available since 08/2024.
GLIWA GmbH & Co. KG
GLIWA is a worldwide leading provider for system performance related analysis and interdisciplinary expert services. With the powerful Analysis Suite T1, we offer the most efficient software-based tools for system analysis, optimization and verification of embedded software. With over 20 years of experience in the field of embedded software runtime optimization, GLIWA offers quick and efficient solutions to a worldwide customer base. Sufficiently optimized embedded software allows for smaller microcontrollers, results in less firefighting, and supports a seamless transition into production. ISO26262 certification for GLIWA products is available.


