Control of a multicore system and debugging is carried out with the UDE 4.2 in a consistently designed user interface. Various colors determinable by the user and user-definable groups of views for individual function units ensure a fast overview and simple navigation, also in complex SoCs. Individual cores can be specifically selected and also synchronized for control by the debugger. This also includes the extensive use of existing on-chip trigger and synchronization options of various device manufacturers. With the UDE 4.2, the consistent user interface ensures the greatest possible flexibility when controlling a multicore target, without the need to know the underlying on-chip logic in detail.
The trace framework of the Universal Debug Engine 4.2 has also been equipped with numerous new features. For example, relocation of the data processing in a separate process not only increases the speed of the evaluation, but also allows persistent storage of trace sessions for analysis at a later time without direct access to the target. Furthermore, comprehensive filters and the possibility to individually color recorded events of various trace sources simplify a clear presentation of the results.
An enhancement of the proven Universal Emulation Configurator (UEC) of the Universal Debug Engine (UDE) ensures an even more efficient use of the so-called Emulation Devices offered by Infineon, Freescale and STMicroelectronics for some SoCs. Programming of the additional trigger logic contained on the Emulation Devices is performed by a graphical configuration of trace tasks, by which signals and actions are linked via a state machine.
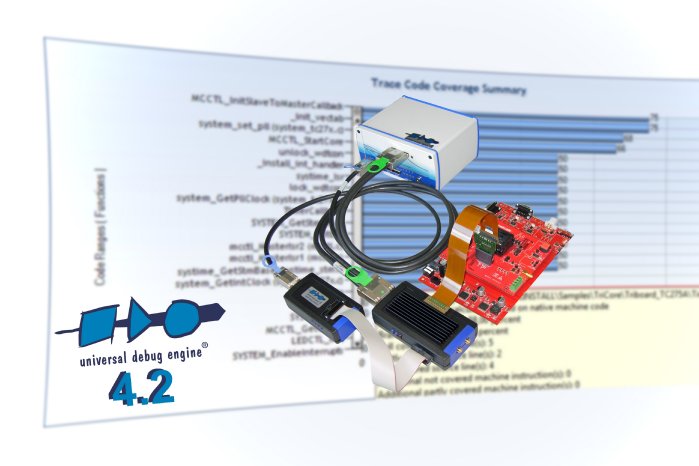
With PLS' Universal Access Device 3+ (UAD3+), a powerful hardware tool with 4 GB external trace memory is available for recording trace data. Thanks to an Aurora trace pod supporting four serial high-speed lanes each with 3.25 gigabit per second (Gbit/s) transfer rate and a parallel trace pod for recording signals up to 500 MHz, the UAD3+ is also well equipped to meet future requirements.
A fast and safe evaluation of immense volumes of trace data is supported by a new module that complies with ISO 26262 requirements, which for the first time also enables coverage analysis of optimized code. At the same time, the DWARF format that is typically used for debugging information has been extended so that control flow changes triggered by the compiler are recognizable for the debugger. In addition to bar graphs for a quick overview, the report generated contains a detailed list of statement and branch coverage per function, source text lines and individual machine instructions. Likewise, code not executed, only partially covered areas of code or jumps not executed can be located very quickly. The report can be used as proof of the software quality assurance in the context of the documents required by the ISO 262626 standard. A first implementation by the compiler manufacturer HighTec has already proven its continuous suitability for practical use.
Microcontrollers (MCUs) newly supported by the UDE 4.2 include the latest steps of Infineon's AURIX family, Freescale's Qorivva MPC57XX family as well as STMicroelectronics SPC57x family. With these three families of MCUs, programs for the integrated Generic Timer Module (GTM) and Hardware Security Module (HSM) can also be debugged. At the same time, the Cortex-R4 based Hercules microcontroller platform from Texas Instruments with the families TMS570LS and RM4x, which were designed specifically for safety-critical applications according to IEC 61508 SIL-3 and ISO 26262 ASIL D, and the Cortex-M0 based XMC1000 devices from Infineon, are fully supported by the UDE 4.2.


