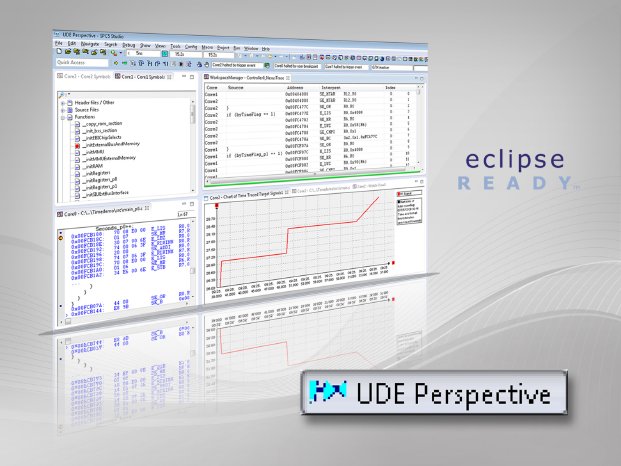
In order to ensure the range of functions, the numerous configuration settings of a cross-debugger are automatically and fully integrated in the Eclipse workspace during installation of the tool. Subsequently, a debug session is defined via the standard mechanism of a launch configuration and started from the C/C++ editor. Display of the instruction pointer and from breakpoints is thereby carried out synchronously in all open perspectives. Breakpoints can be set both in the C/C++ editor and by debugger-specific functions. Furthermore, the C/C++ editors are also fully available in the UDE Eclipse perspective. The paths of the source files are read by the debugger plug-in direct from the Eclipse workspace. This ensures a maximum consistency during the development phase.
The new Eclipse plug-in - as with the previous version that is likewise included in all current UDE installations - is available for all microcontroller architectures and families (including TriCore, PowerArchitecture, XC2000 / XE166, ARM, Cortex, SH-2A, XScale and C166 / ST10) supported by the UDE 4.0. For multi-core debugging, the management of several debugger instances is fully supported. The new tool can be used in both preconfigured installations based on the Eclipse platforms (4.2 Juno, 4.3 Kepler) and Eclipse C/C++ Development Tools (CDT) 8.x such as the STMicroelectronics SPC5 Studio, and on self-configured Eclipse CDT platforms.


